
BR100 Increased By (0.18%)
BR30 Increased By (0.54%)
KSE100 Increased By (0.14%)
KSE30 Increased By (0.19%)
AGHA 6.89 Increased By ▲ 0.03 (0.44%)
BECO 4.40 No Change ▼ 0.00 (0%)
BML 56.99 Increased By ▲ 2.32 (4.24%)
BOP 30.77 Decreased By ▼ -0.20 (-0.65%)
CNERGY 13.20 Decreased By ▼ -0.01 (-0.08%)
CSIL 5.64 Decreased By ▼ -0.08 (-1.4%)
FCCL 54.06 Increased By ▲ 1.10 (2.08%)
FFL 14.67 Decreased By ▼ -0.05 (-0.34%)
FNEL 1.20 Decreased By ▼ -0.06 (-4.76%)
KEL 6.72 Decreased By ▼ -0.02 (-0.3%)
KOSM 5.17 Decreased By ▼ -0.01 (-0.19%)
LOTCHEM 25.61 Increased By ▲ 0.53 (2.11%)
MLCF 96.19 Increased By ▲ 1.41 (1.49%)
NBP 171.08 Increased By ▲ 0.97 (0.57%)
NCPL 57.50 Decreased By ▼ -1.31 (-2.23%)
NPL 63.28 Decreased By ▼ -1.04 (-1.62%)
OGDC 318.41 Increased By ▲ 0.92 (0.29%)
PACE 10.22 Decreased By ▼ -0.08 (-0.78%)
PAEL 36.83 Increased By ▲ 0.28 (0.77%)
PIBTL 16.03 Increased By ▲ 0.07 (0.44%)
PPL 230.51 Increased By ▲ 2.12 (0.93%)
PRL 87.33 Increased By ▲ 0.41 (0.47%)
PTC 63.25 Increased By ▲ 0.36 (0.57%)
SSGC 23.63 Decreased By ▼ -0.18 (-0.76%)
TBL 9.14 Increased By ▲ 0.04 (0.44%)
TELE 7.79 Increased By ▲ 0.11 (1.43%)
TPL 22.04 Decreased By ▼ -0.36 (-1.61%)
TPLP 12.51 Decreased By ▼ -0.16 (-1.26%)
TREET 22.55 Increased By ▲ 0.11 (0.49%)
TRG 51.34 Increased By ▲ 0.34 (0.67%)
BR100 Increased By (0.18%)
BR30 Increased By (0.54%)
KSE100 Increased By (0.14%)
KSE30 Increased By (0.19%)
AGHA 6.89 Increased By ▲ 0.03 (0.44%)
BECO 4.40 No Change ▼ 0.00 (0%)
BML 56.99 Increased By ▲ 2.32 (4.24%)
BOP 30.77 Decreased By ▼ -0.20 (-0.65%)
CNERGY 13.20 Decreased By ▼ -0.01 (-0.08%)
CSIL 5.64 Decreased By ▼ -0.08 (-1.4%)
FCCL 54.06 Increased By ▲ 1.10 (2.08%)
FFL 14.67 Decreased By ▼ -0.05 (-0.34%)
FNEL 1.20 Decreased By ▼ -0.06 (-4.76%)
KEL 6.72 Decreased By ▼ -0.02 (-0.3%)
KOSM 5.17 Decreased By ▼ -0.01 (-0.19%)
LOTCHEM 25.61 Increased By ▲ 0.53 (2.11%)
MLCF 96.19 Increased By ▲ 1.41 (1.49%)
NBP 171.08 Increased By ▲ 0.97 (0.57%)
NCPL 57.50 Decreased By ▼ -1.31 (-2.23%)
NPL 63.28 Decreased By ▼ -1.04 (-1.62%)
OGDC 318.41 Increased By ▲ 0.92 (0.29%)
PACE 10.22 Decreased By ▼ -0.08 (-0.78%)
PAEL 36.83 Increased By ▲ 0.28 (0.77%)
PIBTL 16.03 Increased By ▲ 0.07 (0.44%)
PPL 230.51 Increased By ▲ 2.12 (0.93%)
PRL 87.33 Increased By ▲ 0.41 (0.47%)
PTC 63.25 Increased By ▲ 0.36 (0.57%)
SSGC 23.63 Decreased By ▼ -0.18 (-0.76%)
TBL 9.14 Increased By ▲ 0.04 (0.44%)
TELE 7.79 Increased By ▲ 0.11 (1.43%)
TPL 22.04 Decreased By ▼ -0.36 (-1.61%)
TPLP 12.51 Decreased By ▼ -0.16 (-1.26%)
TREET 22.55 Increased By ▲ 0.11 (0.49%)
TRG 51.34 Increased By ▲ 0.34 (0.67%)
Wednesday, October 7, 2026
Home FOOD/INGREDIENTS Gallup Pakistan Analysis: Income Disparities Drive Severe Food Insecurity Across Households

Gallup Pakistan Analysis: Income Disparities Drive Severe Food Insecurity Across Households

0
20

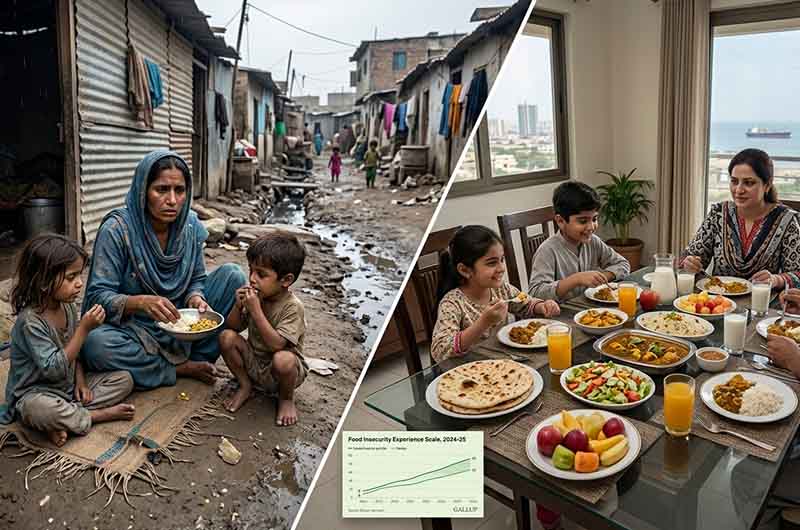
A significant disparity in economic resilience continues to fuel food stress across Pakistan, where nearly a quarter of all families experience moderate to severe food insecurity. According to an analysis of the Pakistan Social and Living Standards Measurement (PSLM)–Household Integrated Economic Survey (HIES) 2024–25, vulnerability is closely linked to household income levels, geographic location, and regional economic divides rather than overall national food availability.

The study utilizes the Food Insecurity Experience Scale (FIES) metric to gauge household stress, covering dimensions such as dietary quality compromises, reduced food intake, and financial anxiety related to securing meals. While overall national food availability has seen slight improvements, access remains heavily constrained by inflation and stagnant purchasing power.

Core Findings:

  • National Impact: Approximately 24% to 26% of Pakistani households suffer from moderate or severe food insecurity, highlighting lingering economic vulnerability nationwide.
  • Economic Inequality: Families in the lowest income quintile are nearly five times more likely to face food insecurity compared to those in the top quintile, underscoring how income disparities dictate basic meal security.
  • Regional Disparities: Balochistan reports the highest rates of household food insecurity in the country, followed closely by Sindh. Conversely, Punjab maintains the lowest overall incidence.
  • Root Drivers: The primary catalyst for food insecurity has shifted toward food affordability and income volatility, rather than shortages in the physical supply of commodities.
  • Policy Direction: The findings underscore an urgent requirement for targeted social safety nets, regional policy measures, and direct income-support initiatives focused on lower-income groups and higher-risk provinces.


LEAVE A REPLY

Please enter your comment!
Please enter your name here