
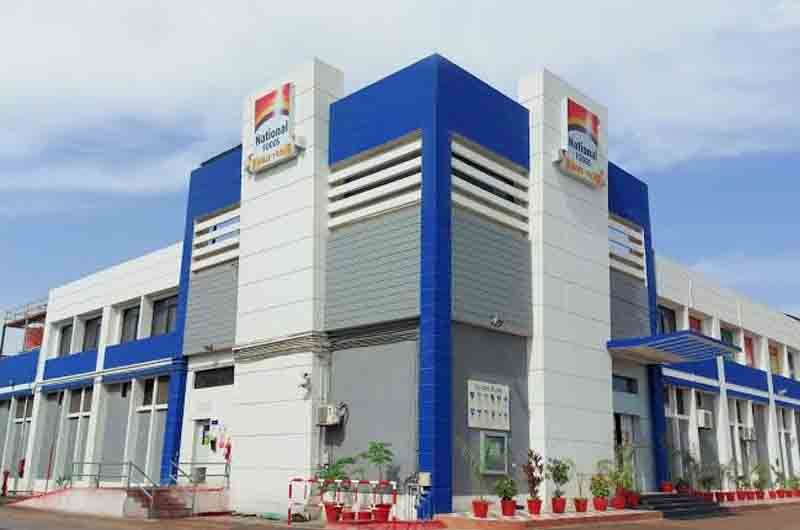
National Foods Limited (PSX: NATF), incorporated in 1971, is one of Pakistan’s leading convenience food manufacturers with a portfolio of 250 products across 12 categories and a global footprint spanning 40 countries across 5 continents. NATF is a subsidiary of ultimate holding company ATC Holdings (Private) Limited.
Shareholding Structure
(As of June 30, 2025 – Total Shares: 233.115 million)
| Shareholder Category | Shareholding % |
| Associated Companies & Related Parties | 59.53% |
| Directors, CEO, Spouses & Children | 18.96% |
| Local General Public | 10.66% |
| Modarabas & Mutual Funds | 3.74% |
| Foreign Companies | 1.66% |
| Others | 5.45% |
Historical Financial Performance (2021–2025)
NATF experienced sustained top-line expansion across the 5-year period, with bottom-line pressure primarily localized in 2024 due to peak inflation, energy costs, and setup expenses for its new plant in Faisalabad.
| Metric | 2021 | 2022 | 2023 | 2024 | 2025 |
| Net Sales (Rs. mn) | 23,115.80 | 26,843.06 | 29,602.88 | 37,377.25 | 44,587.46 |
| Production Volume (MT) | 105,071 | 108,104 | 101,083 | 84,046 | 92,285 |
| Gross Margin (%) | 30.44% | 33.41% | 34.60% | 31.67% | 35.52% |
| Operating Margin (%) | 8.00% | 10.30% | 11.23% | 7.91% | 11.21% |
| Net Profit (Rs. mn) | 1,265.19 | 1,965.08 | 2,188.04 | 1,268.57 | 3,181.40 |
| Net Margin (%) | 5.47% | 7.32% | 7.40% | 3.39% | 7.14% |
| Earnings Per Share (Rs.) | 5.43 | 8.43 | 9.23 | 5.44 | 13.65 |
Yearly Highlights:
- 2021: Post-COVID demand recovery pushed sales up 20% YoY. Lower discount rates reduced finance costs, yielding a net profit of Rs. 1,265.19 million.
- 2022: Topline increased 16.12% YoY, backed by price revisions and export translation gains. Operational efficiency pushed gross profit up by 27.45%.
- 2023: Gross margin reached a then-record 34.60% due to cost control and 77% export sales growth, though interest rate hikes began expanding finance costs (+244% YoY).
- 2024: Higher energy tariffs, elevated policy rates, and capital expenditures for the new Faisalabad plant reduced net margins to 3.39%, dropping net profit by 42% YoY to Rs. 1,268.57 million.
- 2025: Rebound driven by an 18.76% expansion in local sales and 47.81% in export markets. Production volumes recovered 10% to 92,285 MT, while easing policy rates helped net profit jump 150.79% YoY to Rs. 3,181.40 million.
Recent Performance (9MFY26)
NATF maintained its momentum through the first nine months of FY26:
- Topline: Reached Rs. 38,135.14 million, up 12.96% YoY.
- Gross Profit: Rose 23.97% YoY, expanding gross margins to 38.85% (vs. 35.40% in 9MFY25), driven by efficiency gains at the Faisalabad facility.
- Operating Profit: Climbed 47.63% YoY to Rs. 6,237.88 million, yielding an operating margin of 16.36%.
- Net Profit: Surged 82.12% YoY to Rs. 5,198.21 million, with net margins expanding to 13.63% and EPS rising to Rs. 22.30 (up from Rs. 12.24 in 9MFY25).
Strategic Outlook & Future Growth
- Localization & Cost Management: NATF continues shifting raw material sourcing to local supply chains to mitigate exchange rate fluctuations and maintain pricing flexibility.
- Global Network Expansion: To streamline international supply lines in key export regions (North America, Europe, and the Middle East), NATF’s Dubai-based subsidiary, National Foods FZCO, established National Foods Gulf (FZE) in Sharjah.
- Capacity Utilization: Operational scale from the Faisalabad plant continues to improve margins, positioning the company to meet growing local and foreign demand.